


Not long ago, a Db2 for z/OS administrator contacted me with a request. His team had made some changes to the buffer pool configuration in their production Db2 environment (the overall size of the buffer pool configuration was increased to reduce read I/O activity, and greater use was made of large real storage page frames), and they were not sure as to how the performance impact of these changes could be measured. Could I assist with that analysis?
Sure, I said. I asked the Db2 admin to use his Db2 performance monitor tool to generate detailed accounting reports (depending on the monitor used, such a report might be titled ACCOUNTING REPORT – LONG or ACCOUNTING SUMMARY – LONG) capturing activity during periods preceding and following the buffer pool changes – same FROM and TO times, same day of the week for both reports (to make the comparison as “apples to apples” as possible). I also requested that the reports be generated so as to have data aggregated at the connection type level (again, terminology can vary by monitor product – your instruction to the monitor might be to “order” the data by connection type, or to “group” the data by connection type). Why do I like for data in a detailed accounting report to be aggregated in this way? Well, I find the default aggregation specification for Db2 monitor-generated accounting reports – authorization ID within plan name – to be too fine-grained for effective analysis of a Db2 system in an overall sense; conversely, aggregation at the subsystem ID level is generally too coarse-grained for my liking. When data in a detailed accounting report is aggregated at the connection type level, you get within the larger report a sub-report for each connection type used in the Db2 for z/OS system of interest; for example: a sub-report showing all CICS-Db2 work in the system, one showing all batch work that uses the call attachment facility, one showing all batch work using the TSO attachment facility, one showing all DDF-related work (connection type: DRDA), etc. With such a report in hand (or on your screen), you can quickly and easily identify the largest Db2 workload components (with “component” here referring to work associated with a given connection type) and focus your analysis accordingly.
I showed the Db2 admin and one of his colleagues how to put the aforementioned “before” and “after” Db2 monitor accounting reports to use in measuring the impact of the effected buffer pool configuration changes, and I’ll provide that knowledge transfer here in the remainder of this blog entry.
First, I look over the sub-reports (by connection type) within the larger “before” and “after” detailed accounting reports to find the workload components (connection types) that dominate in terms of size. “Size” refers in this case to aggregate in-Db2 CPU cost of SQL statement execution, and that’s easy to determine: for a given workload component (a given connection type), find first the average in-Db2 (i.e., class 2) CPU time (done by summing two values: average class 2 CP CPU time, which is general-purpose CPU time, and average class 2 SE CPU time, which is “specialty engine,” or zIIP, CPU time). Next, take that average class 2 CPU time for the connection type, and multiply it by the number of occurrences (typically, number of accounting records), because “average” is “average per occurrence.” Here is an example of what you might see in one of the sub-reports (this for a DRDA workload), with the numbers I’ve referenced highlighted in red:
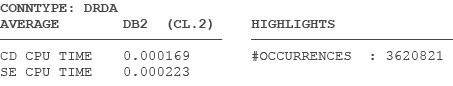
So in this case, aggregate CPU cost of SQL statement execution (in-Db2, or class 2, accounting time is time associated with SQL statement execution) for the DRDA workload component is (0.000169 + 0.000223) * 3620821 = 1419 CPU seconds.
Performing this simple calculation showed that for the overall Db2 workload I was analyzing, the two biggest components by far were the DRDA and CICS-Db2 connection types; so, I didn’t bother with the other much-smaller components (call attachment facility, TSO attachment facility, etc.).
For the two major workload components (DRDA and CICS-Db2), I compared “before” and “after” figures for average class 2 CPU time. That is the key metric for evaluating the impact of a Db2 system or application performance tuning action. Too often, Db2 for z/OS people effect a change aimed at improving workload performance and look, for evidence of improvement, at the total class 2 CPU time for the workload of interest (and by the way, I focus on class 2 CPU time because that is what a Db2 person can influence – class 1 CPU time includes time outside of Db2, over which a Db2 person may not have much control). “Before” and “after” figures for total class 2 CPU time for a workload may show little or nothing in the way of difference, leading a Db2 person to think that a performance tuning action accomplished nothing. In fact, it may be that the tuning change was indeed successful. How could that be, if total in-Db2 CPU time did not decrease? Simple: look for a change in throughput (the number of commits is a pretty good indicator of “pieces of Db2 work” completed on a system). A Db2 tuning change might reduce average in-Db2 CPU time per transaction (or, more broadly, per unit of work), and that might result in greater throughput (units of work completed in a given time period), and that (more transactions completed, at less in-Db2 CPU time per transaction) might result in a non-decrease in the total in-Db2 CPU time for the workload. In my experience, greater throughput with no increase in total in-Db2 CPU time for a workload is a GOOD thing. If you see increased throughput following a Db2 performance tuning change and your organization actually wants to keep throughput at the lower “before” level, that can be accomplished by limiting the availability of Db2 threads for the workload in question – essentially, you keep a lid on throughput by introducing some queuing for Db2 threads.
OK, so your focus as a Db2 person should be on reducing average class 2 CPU time for a workload, as indicated in a Db2 monitor-generated accounting report (or an online monitor display of thread activity on the system – but I prefer to look at accounting reports); and, in tracking this, make sure that you look at “average total” class 2 CPU time, meaning the sum of average class 2 general-purpose CPU time (usually labeled CP CPU time) and average class 2 zIIP CPU time (usually labeled SE CPU time) – always check the average class 2 zIIP CPU time, even for non-DDF-related applications that you might not think of as drivers of zIIP utilization, because that zIIP time figure could be non-zero (for example, if some queries in a batch job are parallelized by Db2, some of the batch job’s class 2 CPU time will be consumed on zIIP engines because the “pieces” of queries parallelized by Db2 are zIIP-eligible). As indicated by the average-class-2-CPU-time yardstick, how did the Db2 team with which I worked do, with regard to improving application workload?
They did quite well:
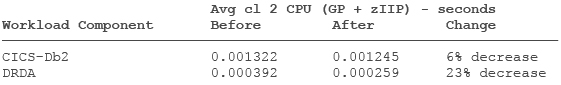
That 6% improvement in average class 2 CPU time for CICS-Db2 transactions is close to what I am accustomed to seeing as a result of buffer pool actions such as those taken by the Db2 team in the case of which I’m writing: larger buffer pools, and greater use of page-fixed pools backed by large real storage page frames, tend to shave a few percentage points off of average class 2 CPU times reported by a Db2 monitor. A modest improvement of that nature is generally welcome, as it requires no application code changes and positively impacts a large number of programs (it’s the kind of change that I put in the “rising tide lifts all boats” category).
What about the 34% improvement in class 2 CPU efficiency seen for the DRDA workload as a result of the buffer pool changes? Why such a large improvement? Here’s my theory: as is true in many cases, the SQL statements associated with the DRDA workload at this site are overwhelmingly dynamic in nature (that is commonly seen when DDF transactions do not make heavy use of static SQL-issuing stored procedures). Dynamic SQL statements can be automatically re-optimized on a regular basis, particularly when a “bounce” (stop and restart) of a Db2 subsystem requires total re-population of the Db2 dynamic statement cache in memory (where the prepared-for-execution form of dynamic SQL statements are stored for re-use). The Db2 subsystem on which this blog entry is focused was indeed bounced on the weekend during which the buffer pool changes were put into effect, so ALL of the dynamic SQL statements coming into the system following that Db2 stop/restart were optimized at first execution. And here’s the thing: it’s not just indexes and catalog statistics that influence SQL statement access path selection. Db2 memory resources – particularly buffer pool resources – are another factor. I have a feeling that when the dynamic SQL statements (especially queries) associated with the DRDA workload were re-optimized following the significant changes made to the Db2 subsystem’s buffer pool configuration, some new and better-performing access plans were generated. Further evidence of positive access path changes: average GETPAGEs per transaction for the DDF workload decreased by 24% following the buffer pool changes. GETPAGE activity is a major determinant of the CPU cost of SQL statement execution, and a substantial decrease in such activity is often indicative of access path changes.
This kind of begs the question: would a rebind of the packages associated with the CICS-Db2 workload (a workload for which, at this site and many other sites, almost 100% of the SQL statements are static) following the buffer pool changes have led to per-transaction CPU efficiency gains going beyond the 6% improvement that we saw? Quite possibly. That’s something to think about. If you do decide to rebind static SQL packages following some significant buffer pool changes, keep a couple of things in mind. First, rebinding with APCOMPARE(WARN) will cause Db2 to let you know (via message DSNT285I) when access paths change for one or more statements associated with a package (information about access path changes is provided in the REMARKS column of the PLAN_TABLE when a package is rebound with EXPLAIN(YES)). Second, if access paths change and package performance gets worse as a result (not likely, but possible), you can quickly and easily put the previous instance of the package back into use through a REBIND with SWITCH(PREVIOUS), assuming that plan management is in effect for your Db2 subsystem (and it is “on” by default – check the value of the PLANMGMT parameter in the ZPARM module). Together, these Db2 features are aimed at “taking the fear out of rebinding,” as a former colleague of mine so aptly put it.
So, there you go. If you make Db2 changes aimed at boosting performance for a workload, measure the result using the average class 2 CPU time figures provided in Db2 monitor-generated accounting detail reports that show activity from “before” and “after” time periods. Buffer pool changes (larger pools, greater use of page-fixed pools backed by large real storage page frames) usually reduce average class 2 CPU time by a few percentage points. Greater performance gains could be seen if the buffer pool changes enable Db2 to choose new and better-performing access paths for SQL statements. Those statement re-optimization actions tend to be automatic for dynamic SQL statements (especially if a Db2 subsystem’s dynamic statement cache has to be re-populated). For static SQL, package rebind is needed for statement re-optimization. Rebinding with APCOMPARE(WARN) and EXPLAIN(YES) will provide information about access path changes, and in the unlikely event of a negative performance result following re-optimization, rebinding with SWITCH(PREVIOUS) puts the previous instance of the package back into use.
Robert Catterall is a Senior Consulting Db2 for z/OS Specialist with IBM. He has worked in IT for 37 years, and has worked with Db2 for z/OS - as an IBMer, an independent consultant, and a user - since 1987.