


Part 2: Understanding MIPS and MSU
This is the second in a series of blogs about how to follow up on your mainframe outsourcer. The first blog was about why it is important to follow up, and some of the pitfalls of not doing so. This article focuses on explaining the two metrics that are generally used as the basis for mainframe capacity billing: MIPS (million instructions per second) and MSU (million service units).
Technical experts spend entire careers on the question of how to measure and pay for mainframe CPU capacity. It is a multimillion-dollar question and one that often creates confusion between the technical experts who understand the measurements and the businesspeople who sign the contracts and pay the bills.
MIPS and MSU are units quantifying how much CPU capacity a given workload has consumed. IBM and other software providers bill variable software licenses, typically the main cost driver for the mainframe, based on the number of MSUs used by a workload. Outsourcers typically bill their shared-service customers for mainframe capacity usage based on either MIPS or MSUs.
MIPS
Although MIPS is an abbreviation for million instructions per second, it no longer has any direct relationship to number of instructions. Instead, it is a way of normalizing CPU usage across different CPU types and models or hardware configurations. The idea is that a certain workload will consume close to the same number of MIPS on different hardware configurations. In other words, if your outsourcer upgrades the underlying hardware behind your environment to faster hardware, you can expect to continue to pay for roughly the same number of MIPS.
MIPS cannot be measured directly but can be computed by measuring the number of seconds the CPU is busy on a certain workload and then multiplying those “CPU seconds” by a configuration-dependent MIPS factor. This is like calculating a volume of water consumed by counting the number of bottles and multiplying that by the capacity of the bottles. The MIPS factor corresponds to the size of each water bottle.
Determining the correct MIPS factor for a given configuration is a big topic, which I will cover in a later blog. The important thing for a business to understand is that any contract based on MIPS should also specify how the MIPS are calculated; otherwise, it’s like buying water by the bottle without indicating the size of the bottles. This specification should include how the “effective” machine model is determined and which MIPS factor table is used; different methods can easily result in differences of 10-20% or more in computed MIPS, often equating to hundreds of thousands of Euro per year. There are several sources for MIPS factor tables, but those produced by Watson Walker (and IBM) are generally considered the industry standard.
MSU
MSU is a metric that IBM originally created to normalize CPU utilization across different hardware configurations. While MIPS are calculated based on factors that are always open to interpretation, MSUs are calculated directly by the operating system, based on factors determined by IBM. There are, however, several pitfalls surrounding MSUs as well.
First, there are hardware MSUs and software MSUs and the two are no longer related. Depending on the machine, one software MSU represents roughly 50% more capacity used than one hardware MSU. Note that the term “service unit” alone (as used by most tools) refers only to hardware service units, but the term MSU can refer to either hardware or software MSUs. We will ignore hardware MSUs here since they are seldom used for billing. Just be aware that hardware MSUs can cause confusion if used in discussions with technical personnel.
Software MSUs were created by IBM to support the billing of software licenses based on CPU utilization. As with MIPS, MSUs normalize CPU utilization so that a given workload always uses about the same number of MSUs and, therefore, has the same cost—independent of the hardware configuration. But, in contrast with MIPS, the number of software MSUs for a given workload has historically decreased as you move to more modern hardware. This has been IBM’s way of giving customers a discount on software running on newer hardware, referred to as the technology dividend. However, it appears IBM has stopped giving the dividend on the most recent models. So, while MIPS is a purely technical metric, software MSUs are affected by IBM’s pricing policies.
To further complicate matters, IBM’s variable software costs are normally based on the monthly rolling four-hour average (R4HA) of the software MSU usage. The monthly R4HA MSU peak is the number captured by the sub-capacity reporting tool (SCRT). The SCRT report forms the basis for IBM’s (and other software vendors’) software billing.
The chart below shows an example that compares MIPS and MSU usage over one day.
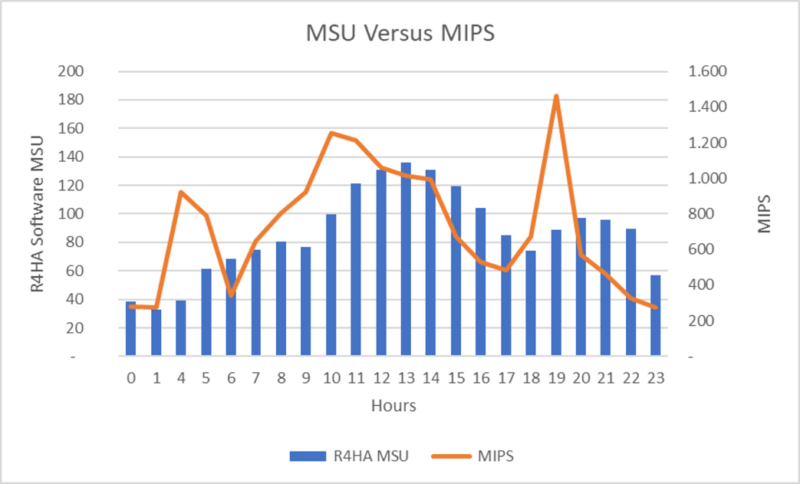
The MSUs shown are the R4HA MSUs. Note that, due to the rolling average, the MSU peaks are flatter and occur with a delay, compared with the MIPS peak.
Be aware that MSU are only measured at the LPAR level and not at a more detailed level like the job or transaction level. MSU are only defined for general processors (GCP’s) and not for specialty processors like zIIP or IFL.
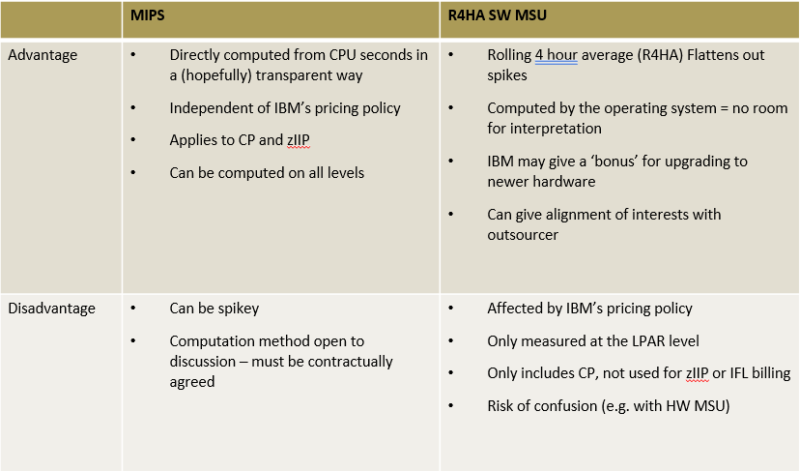
Here is an overview of some of the tradeoffs between MIPS and MSU for billing purposes:
In summary, both MIPS and MSU are useful metrics for quantifying the CPU consumption of a given workload in a way that is relatively independent of the underlying hardware configuration. Both metrics are commonly used as a basis for billing but can be ambiguous if not carefully defined in the contract.
In the next blog I’ll dig into the details of MIPS calculation methods and some of the pitfalls around them.
Originally posted on SMT Data’s Blog:
Steven Thomas is the CTO and COO at SMT Data – the Specialists in IT Business Intelligence. Steven holds a Master’s degree in Computer Science from Stanford and brings almost 30 years of technical and business experience from Saxo Bank, Fidelity Information Services and IBM.